See what is stored on site between visits.
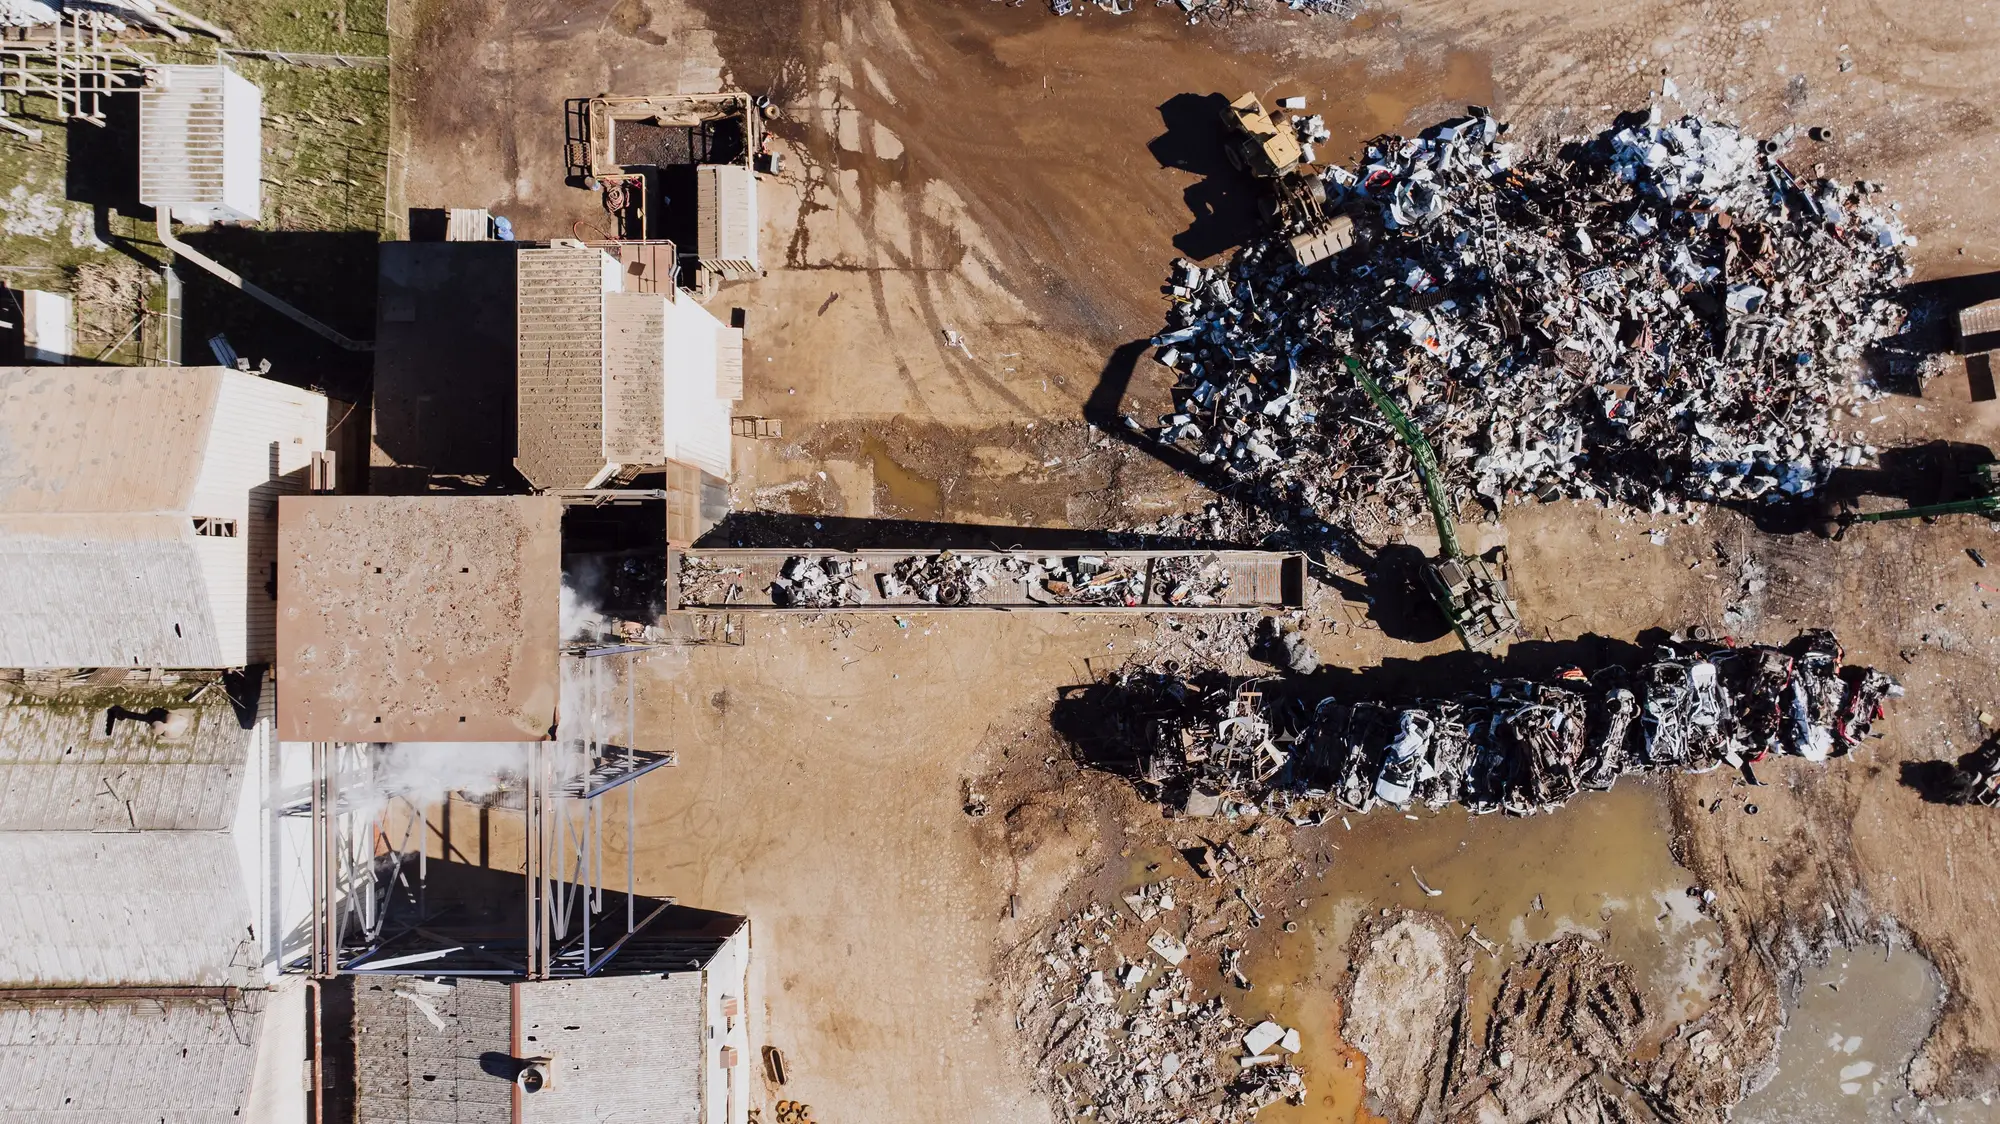
Recycling Facility Map counts and measures the stockpiles in each storage bay every month from very-high-resolution imagery, then sets the volumes beside the limits in your permit.
- GSD
- ≤0.5 m (VHR)
- Cadence
- Monthly
- Platform
- VHR satellite / aerial
- Spectral
- RGB
- Reported by
- Storage bay
The job today
How stock gets checked now
An inspector arrives at a permitted site with the permit conditions and the site plan on the clipboard. The operator walks them round. In each bay the inspector looks at a pile and judges it: how high, how wide, whether it stays inside the marked area, whether it looks like more than the permit allows for that material. The judgement goes into the visit report with a few photographs.
Then the inspector leaves, and nobody who works for the regulator sees the yard again until the next scheduled visit. Stock moves in the meantime. A bay fills after a price drop, a pile creeps past its marked edge, a heap of something that should have gone out last month is still there. What the file holds for the weeks between is the operator's own records and whatever a neighbour reported.
The visits are not the problem, and nothing here replaces one. The gap between them is. A monthly count from above gives you a figure to look at before you decide which site to visit early, and what to ask the operator when you get there.
What you get
What comes back each month
One delivery per monthly pass over the facility boundary. On a pilot, that covers the sites you pick.
2.1Material-count layer
GeoPackage or shapefile
Detected material by storage bay, mapped against your site plan, one layer per month so you can step back through the months.
2.2Stockpile volume estimate
CSV
A volume in cubic metres for each stockpile, taken from a height read off the imagery. Read the figure as an estimate from above. It is not a weighbridge reading and not a surveyed volume.
2.3Permit-comparison table
CSV
Measured volume per bay beside the limit you give us from the permit, with the gap between them. Because the permit states tonnes and the imagery gives cubic metres, you supply the density assumption for each material stream, and the table shows it so you can change it.
2.4Unmeasured flags
Flag list
Bays or parts of bays the imagery cannot see (under a roof, under a sheet, in shadow, hidden by a vehicle or a container) are listed as unmeasured with the reason. They go on the list for your next visit and are not given a number.
How it works
How a pilot runs
3.1Facility in
Send the site plan (PDF, CAD or a boundary shapefile) and mark the storage bays. Tell us which material stream each bay holds and, if you want the comparison table, the limit from the permit for each.
3.2Imagery
Each month we pull the clearest usable very-high-resolution pass over the site, at 0.5 m or finer.
3.3Measurement
Stockpiles are picked out in each bay, outlined and given a volume. Anything the imagery cannot see is flagged.
3.4Table delivered
The map layer, the volume estimates, the permit-comparison table and the flag list, with a call to go through the first delivery.
Where it fits
Between compliance visits
Read the table before the visit programme is next reviewed. A bay running close to its limit, or a site where several bays are flagged unmeasured, is a reason to move a visit forward or to ask the operator for records before you arrive. When you do visit, you walk in knowing which bays to look at first.
Recyclers can read the same footprint data a different way: as a view of how much of a material stream is sitting at a yard, to plan buying without a phone call to every site. That reading uses the same count and the same limits listed below. A recycler asking for it is a separate pilot from a regulator asking for it.
Limits
What the imagery cannot do
L1Volume is an estimate
Volume comes from a height read off imagery and the footprint of the pile. It is not a weighbridge figure and not a certified survey. Tonnes depend on a density assumption for the material, and mixed loads vary more than a single stream does.
L2Resolution floor
At 0.5 m a pixel is wider than a shredded fragment. A pile reads as a pile, with its outline and height. What it is made of inside, or whether a bay mixes streams, is beyond what the imagery shows.
L3Cover and shadow
Material under roofing, sheeting, in a building or in deep shadow cannot be seen from above. Those areas are flagged unmeasured and never estimated.
L4Monthly, not live
One pass a month, when the sky is clear enough. A cloudy month can mean a late delivery or a gap, and a pile that grows and is cleared inside a month is not seen at all.
L5A table, not a finding
The comparison shows the gap between what we measured and the limit you entered. It does not say a site is compliant or in breach. That judgement, and any enforcement step, stays with the inspector.
Who it's for
Who it's for
For
- Permit compliance inspectors and waste site officers who plan visits across a set of licensed sites.
- Team leaders deciding where a limited number of inspection hours go.
- Recycling buyers who want a view of feedstock held at a yard (a separate pilot).
Not for
- Work that calls for a weighbridge reading, a certified survey volume or evidence for a legal case without a visit.
- Sites where most stock is kept indoors or under cover.
- Continuous or live monitoring of a yard.
- Identifying what mixed material contains, or hazardous waste by type.
FAQ
Questions before a pilot
Does this replace a site visit?
No. It is a desk check between visits. The inspector still walks the yard and writes the report.
How is volume worked out?
From a height model read off the imagery, applied to each outlined pile. We give a volume in cubic metres. Converting to tonnes needs a density you choose for the material.
What if part of the yard is hidden?
It comes back flagged as unmeasured, with the reason. We do not put a number on something we could not see.
How do we check it against what we know?
Choose a site you visited recently, send us the plan and the permit limits but not your own estimates, and compare our volumes with your visit notes bay by bay. Decide from that whether the table is good enough to plan visits with.
How current is the count?
As current as the latest clear pass. It is a monthly picture, not a live one.
Can we use the table as evidence?
Treat it as a reason to visit or to ask the operator questions. Anything you rely on in a case should come from your own inspection.
Will it load into our systems?
It comes as a GIS layer plus CSV files keyed to your bay names. We do not write into your case management system.
Who owns the results and the imagery?
Ownership and licence terms are written into the pilot agreement before anything is ordered. If your legal team needs to see them, ask early.
How is a pilot bought and priced?
The quote depends on the number of sites and the imagery source. Tell us how your organisation buys services and we will scope the pilot to fit.
Start a pilot
Get a monthly count.
Tell us which sites you would put in a pilot and what limits you check them against. We will say whether the imagery calendar can cover them.